As we discussed here, diagramming is the inevitable activity of software architect and other developers. Also, here and here we discuss elegance of software documentation, that each project must have only one long README file. Also, your repository should have as little as possible of static files, like images, pdf, etc. Simply because, git doesn’t understand how to do versioning on them. In this guide, I will show how to compile your diagrams, written in PlantUML notation to SVGs. As always, fully automated, on GitHub.

Create .puml Diagram
First, let’s create a new diagram in PlantUML notation:
@startuml
actor       TelegramUser as user
participant Bot as bot
participant Hub as hub
database    Database    as db
participant Notifications as notifications
participant GitHub as github

user -> bot : Chat ID
bot -> hub : Token, Chat ID
hub -> notifications: GitHub Token
hub -> db: Chat ID, Token
notifications -> github: GitHub Token
github --> notifications: Subscription, Data Stream
notifications --> hub: Token, Data Stream
hub -> db: Chat ID by Token
db --> hub: Chat ID
hub --> bot: Chat ID, Data Stream
bot --> user: Data Stream
@enduml
Create GitHub Workflow:
Then we need to create simple GitHub action for PlantUML.
On each new change it will automatically compile the .puml into SVG and push to the git branch.
Here it is:
name: plantuml
on:
  push:
    paths:
      - '**.puml'
    branches:
      - master
permissions:
  contents: write
jobs:
  plantuml:
    runs-on: ubuntu-20.04
    steps:
      - name: Checkout Source
        uses: actions/checkout@v2
      - name: Generate SVG Diagrams
        uses: holowinski/plantuml-github-action@main
        with:
          args: -v -tsvg diagrams/*.puml
      - name: Commit changes
        uses: EndBug/add-and-commit@v9
        with:
          author_name: <github nickname>
          author_email: <git email>
          message: 'diagram generated'
          # destination folder
          add: 'diagrams/*'
Pay attention to that, this workflow should be in the master branch first.
Create Pull Request with Diagram Changes
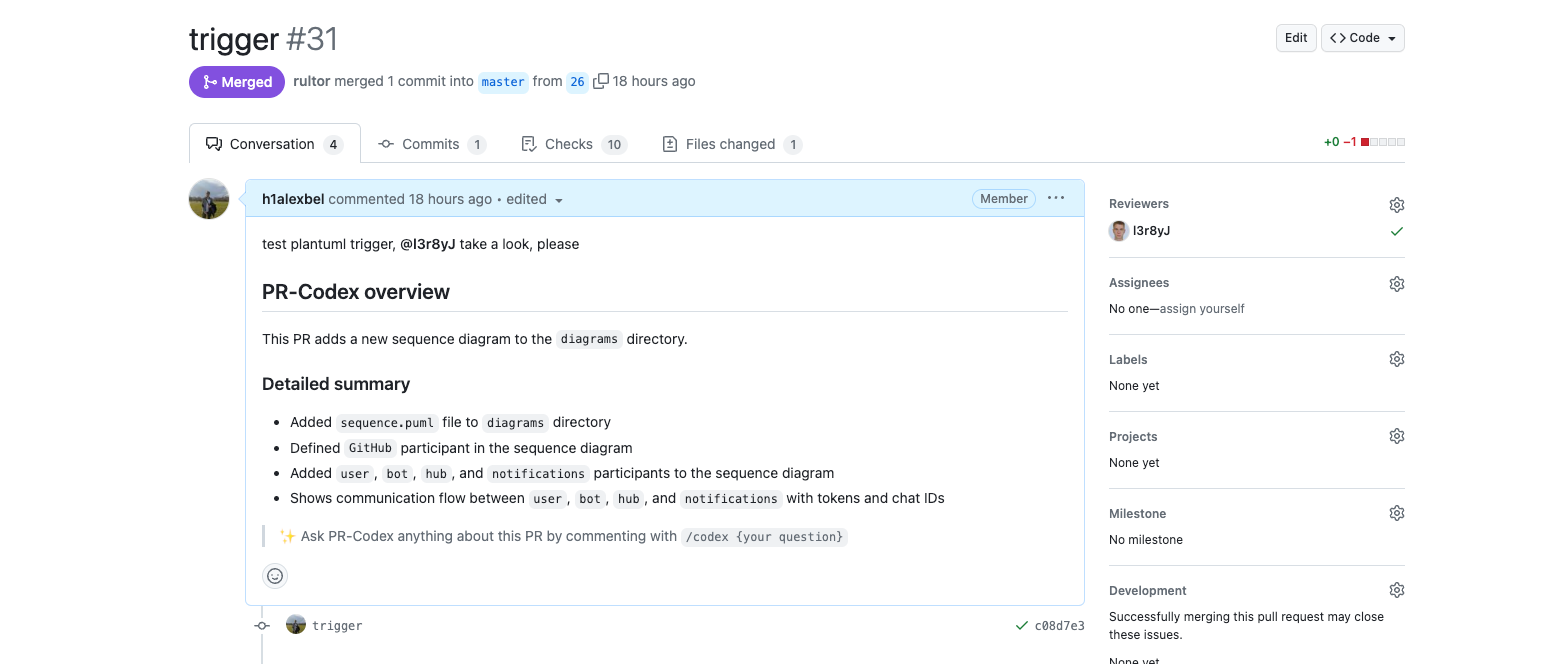
Merge it
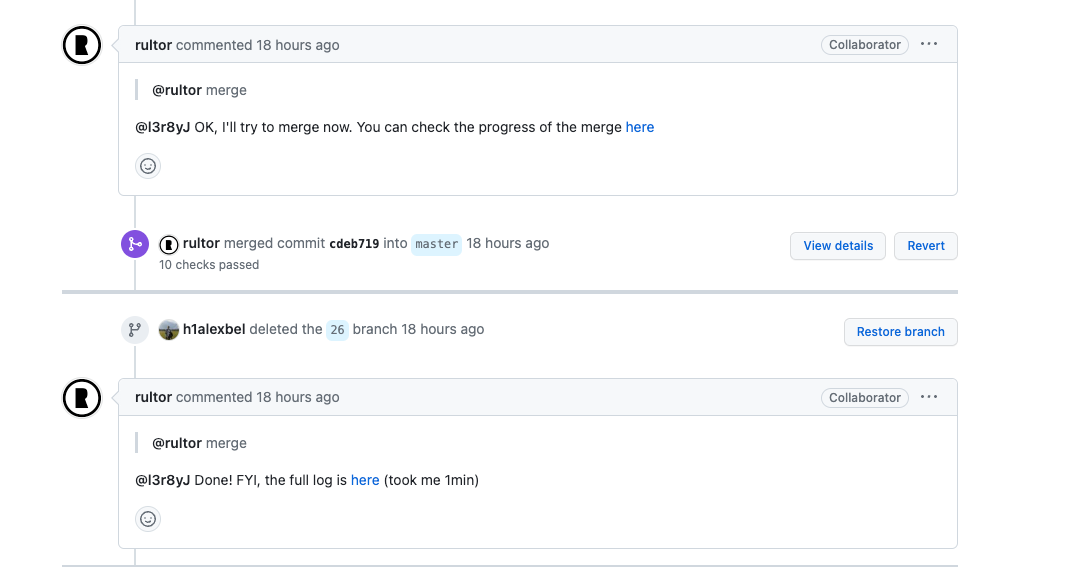
After merging it into master branch, diagram will be compiled to SVG and pushed there.
Get the Diagram

Diagramming made easy!
Full example at blamer-io/hub/#31; Result is here.